Solar Panel Soiling Loss in Australia: How Much Dirt Is Costing You
Soiling — dust, grime, and biological growth on panel surfaces — silently drains solar output across Australia. This is exactly how much it's costing you, by state, and when to act.
Your solar panels generate electricity every single day. But most Australian solar owners don’t realise that a thin layer of accumulated dirt — what the solar industry calls solar panel soiling — is quietly eroding that output, often by far more than they’d expect.
Solar panel soiling is the collective term for all surface contamination on solar panels: dust, bird droppings, pollen, smoke residue, salt film, and biological growth. It’s the number one cause of performance degradation in operating solar systems. Unlike cell degradation (which is gradual and irreversible), solar panel soiling loss is completely recoverable.
This guide quantifies exactly what solar panel soiling is costing Australian solar owners — by location, by season, and by system size.
Key Takeaways
- Dirty panels cost Australian homeowners money every year through solar panel soiling loss.
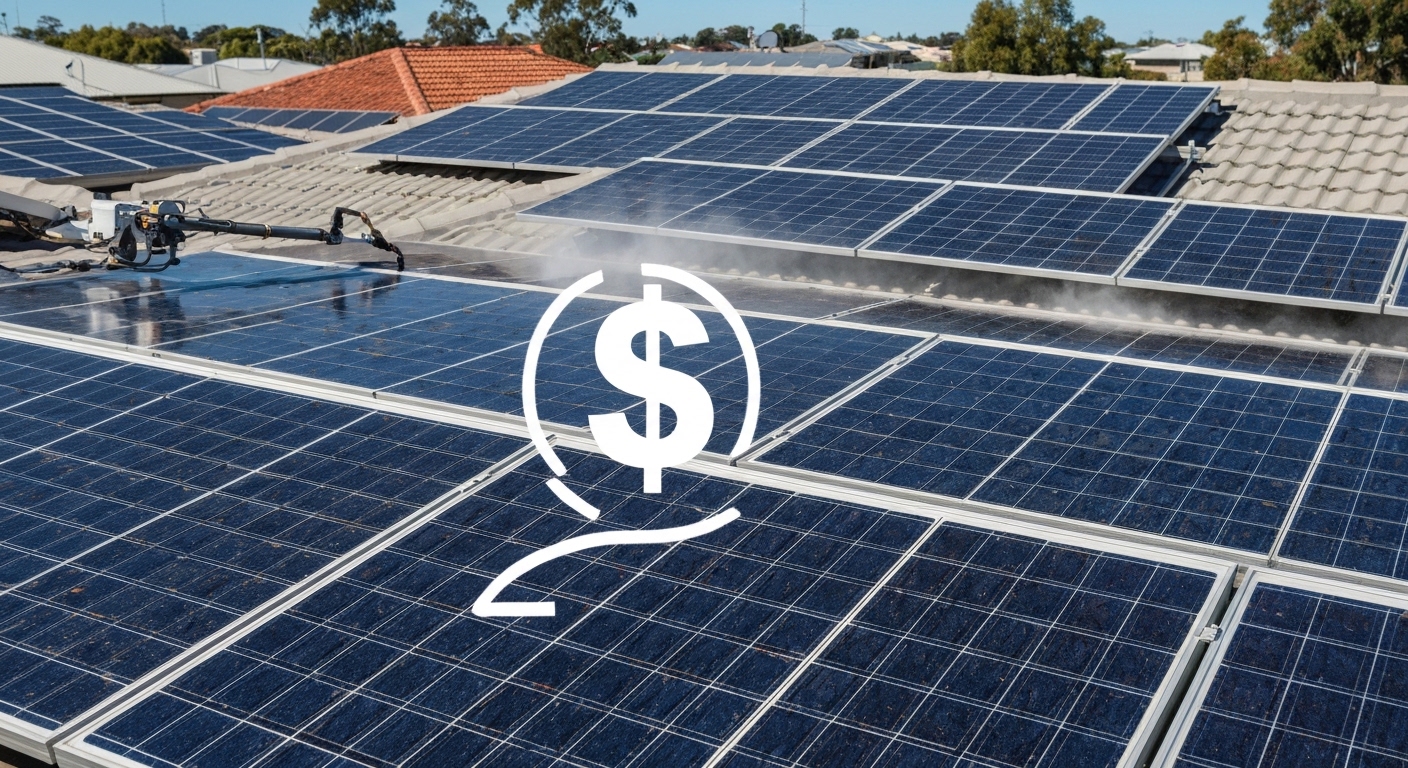
- A 6.6 kW system can lose $200 to $400 annually from soiling.
- Dust, bird droppings, and pollen are the main causes of solar panel soiling.
- A professional clean costs $150 to $350 and usually pays for itself.
- Panels near roads or farms get dirty faster due to increased soiling.
- Monitor your output monthly to spot solar panel soiling loss early.
Understanding Solar Panel Soiling Loss: The Physics
Solar cells produce electricity in proportion to the light they receive. Any material on the panel surface that blocks, scatters, or absorbs light before it reaches the cells reduces output. This is the core of solar panel soiling loss.
There are two mechanisms:
Uniform soiling (dust film, thin aerosol deposits): Reduces light transmission evenly across all cells. Output drops proportionally. A 10% dust film creates roughly 10% solar panel soiling loss.
Localised shading (bird droppings, thick lichen patches): Creates hard shadows over individual cells. Because panels wire cells in series, shading one cell affects the entire string. A single pigeon dropping covering 2% of a panel’s area can cause 15–30% output loss from that panel due to bypass diode activation.
This is why bird droppings cause disproportionate solar panel soiling loss relative to their size.
Solar Panel Soiling Loss Rates Across Australian States
Not all Australian locations experience the same soiling intensity. The key variables affecting solar panel soiling loss are:
- Aridity — dustier in arid zones
- Agricultural activity — crop harvesting and soil disturbance generates airborne particles
- Coastal proximity — salt aerosol deposition within 5km of coastline
- Vegetation — heavy eucalypt and acacia pollen in spring
- Bushfire proximity — soot and smoke residue from nearby burns
- Rainfall frequency — infrequent rain allows solar panel soiling to accumulate
Annual solar panel soiling loss estimates by region:
| Region | Typical Annual Soiling Loss | Primary Soiling Type |
|---|---|---|
| Sydney metropolitan | 3–6% | Urban dust, bird droppings |
| Melbourne metropolitan | 2–5% | Pollen, urban dust |
| Brisbane / SEQ | 4–8% | Organic growth (humid), bird droppings |
| Perth metropolitan | 5–10% | Coastal salt + inland dust |
| Adelaide metropolitan | 6–12% | Agricultural dust, dry climate |
| Darwin / Top End | 8–15% | Red dust, wet season biological growth |
| Inland NSW / Victoria | 10–20% | Agricultural dust, sparse rainfall |
| Outback QLD / SA / WA | 15–30%+ | Red dust, very low rainfall |
| Coastal <2km from ocean | 6–12% | Salt film, high humidity growth |
These are annual averages. Peak solar panel soiling loss during dry seasons or high-dust events is often significantly higher.
What Solar Panel Soiling Loss Costs in Dollar Terms
Let’s make this concrete for a 6.6kW residential system in different Australian locations:
System assumptions:
- 6.6kW installed capacity
- Average Australian solar tariff: 30¢/kWh (feed-in + self-consumption blend)
- System generates approximately 24–30 kWh/day in most capitals
- Annual generation ≈ 9,000–10,800 kWh
| Location | Estimated Annual Soiling Loss | Annual $ Lost (at 30¢/kWh) |
|---|---|---|
| Melbourne CBD | 3% = 300 kWh | ~$90 |
| Sydney metro | 5% = 500 kWh | ~$150 |
| Brisbane metro | 7% = 700 kWh | ~$210 |
| Perth metro | 8% = 800 kWh | ~$240 |
| Adelaide metro | 10% = 1,000 kWh | ~$300 |
| Inland NSW/Vic | 15% = 1,500 kWh | ~$450 |
| Outback/arid | 25% = 2,500 kWh | ~$750 |
For context: A professional clean typically costs $150–$350 and restores full output. In moderate-to-high soiling areas, the return on investment for regular cleaning is strongly positive. Solar panel soiling loss is expensive when left unchecked.
Seasonal Solar Panel Soiling Patterns in Australia
Solar panel soiling isn’t constant throughout the year. Understanding seasonal patterns helps you time cleaning for maximum impact and minimise solar panel soiling loss.
Spring (September–November)
Peak pollen season. Eucalypts, acacias, and introduced species release heavy pollen loads. Pollen is sticky and adheres to panel glass more strongly than mineral dust. Panels in well-vegetated suburban areas can accumulate visible yellow-green pollen films rapidly.
The combination of spring pollen and post-winter reduced cleaning frequency makes this the highest-impact cleaning window for reducing solar panel soiling loss.
Summer (December–February)
Bushfire and dust season. Smoke from bushfires deposits a fine sooty residue that’s particularly difficult to remove with rain alone. In major fire years (such as the 2019–20 Black Summer), urban panels in Sydney and Melbourne sustained persistent soiling from weeks of smoke.
Outback areas experience their peak dust periods in summer. This creates significant solar panel soiling loss.
Autumn (March–May)
Relative respite in most areas. Some biological growth (algae, moss) begins establishing in cooling, wetter conditions in southern states.
Winter (June–August)
Biological growth peak in humid coastal areas of NSW, Victoria, and QLD. Longer night periods and morning dew create conditions favourable for algae and lichen establishment. Lower sun angles mean panels are cleaned less effectively by infrequent rain. This can lead to unexpected solar panel soiling loss even in wetter months.
Measuring Your Own Solar Panel Soiling Loss
You don’t have to estimate — you can measure your system’s solar panel soiling loss precisely.
Method 1: Inverter Monitoring Comparison
- Note your system’s daily output on a clear day after rain (freshly washed baseline).
- Note daily output after several weeks without rain in similar weather.
- The percentage drop is your solar panel soiling loss for that period.
Method 2: Clean vs. Dirty Panel Test
- Clean just one panel thoroughly.
- Compare its output against adjacent uncleaned panels over 3–7 days (requires per-panel monitoring — available on Enphase and SolarEdge systems).
- The output difference equals your solar panel soiling loss per panel.
Method 3: Performance Ratio Monitoring
- Your inverter app’s “performance ratio” metric accounts for weather. It compares actual versus expected output.
- Performance ratio declining steadily between cleaning events indicates measurable solar panel soiling loss.
The Optimal Cleaning Schedule by Region to Reduce Solar Panel Soiling Loss
Based on soiling rate data and cleaning economics:
| Region | Recommended Clean Frequency | Estimated Annual Benefit |
|---|---|---|
| Wet tropical (Darwin, Cairns) | 3–4 times/year | Recover 10–15% annual output |
| SE coastal (Syd, Melb, Bris) | 1–2 times/year | Recover 5–10% annual output |
| SW WA (Perth + agricultural) | 2–3 times/year | Recover 8–15% annual output |
| SA (Adelaide + regions) | 2–3 times/year | Recover 10–18% annual output |
| Inland/arid (regional NSW, QLD) | Quarterly | Recover 15–25% annual output |
What About Panel Self-Cleaning?
Some modern panels are marketed with hydrophilic anti-soiling coatings. These are glass treatments that cause water to sheet off more effectively, taking loose particles with it.
These coatings help with mineral dust in rainy climates. However, they don’t prevent:
- Bird droppings (adhesive protein bonds)
- Lichen and algae (biological attachment)
- Pollen (sticky adhesion)
- Smoke residue (fine particles in oils)
Self-cleaning coatings reduce cleaning frequency requirements in favourable conditions. They don’t eliminate solar panel soiling loss or the need for cleaning.
The Bottom Line on Solar Panel Soiling Loss
Solar panel soiling is silently stealing between $90 and $750+ per year from Australian solar owners, depending on location. Unlike panel degradation, every dollar of solar panel soiling loss is completely recoverable.
The economics are simple. In most Australian locations outside of the wettest coastal areas, a single professional clean pays for itself within 6–18 months in recovered electricity value.
The optimal strategy is straightforward: monitor your inverter output, watch for unexplained performance drops, and clean on a schedule matched to your region’s soiling intensity. For most Australians, that means cleaning once or twice a year. You’ll need more frequent cleaning if you’re in an agricultural, inland, or high-dust area.
Dirty panels are an expensive habit. Clean panels pay for themselves. Addressing solar panel soiling loss is one of the highest-return maintenance activities for solar owners.
How to Track Solar Panel Soiling Loss in Real Time
Modern inverter monitoring platforms make it straightforward to quantify exactly what solar panel soiling is costing you. Here’s how to use what you already have:
SolarEdge: The monitoring portal shows per-panel output and calculates a Performance Ratio that accounts for weather. A steadily declining PR between cleaning events is a direct measure of solar panel soiling accumulation. SolarEdge’s “Site Dashboard” shows historical performance comparisons. Compare the week after your last clean to current week in similar weather.
Enphase Enlighten: Per-microinverter data lets you identify individual panels with higher-than-average soiling. These are typically the ones under bird flight paths or beside a tall tree. Export monthly energy reports and compare against the same month in prior years to spot solar panel soiling loss trends.
Fronius Solar.web: Daily energy production graphs make it easy to spot the “clean day” spike after a good rain or a manual clean, versus the gradual decline as solar panel soiling accumulates.
Sungrow iSolarCloud: Tracks performance ratio and generation efficiency. Daily output trending downward in stable-weather periods equals solar panel soiling accumulation.
If your inverter doesn’t offer per-panel monitoring, a simple approach works. Record your system’s daily kWh output on the same day each week for a month. A steady decline in clear-weather output over 4–6 weeks confirms solar panel soiling is building.
Solar Panel Soiling Loss vs. Panel Degradation: Knowing the Difference
Not every drop in output is soiling. It’s important to distinguish between the two, because their solutions are different.
Solar panel soiling loss:
- Recoverable — a good clean restores output
- Often sudden or weather-correlated (output drops after a dry spell or dust event)
- Responds to rain (partial recovery after good rainfall)
- Visible on panel surface
Panel degradation:
- Permanent — cannot be recovered through cleaning
- Gradual — industry standard is 0.5% per year for quality panels
- Does not respond to cleaning
- May be visible as yellowing, browning, or cell discolouration
Simple test: Clean your panels thoroughly. If output returns to near-original baseline, the loss was soiling. If output after cleaning is still measurably below original levels, you have degradation. This may be a warranty matter if it exceeds the manufacturer’s specified degradation rate (typically 0.5–0.7% per year).
Most manufacturers warrant against “excessive degradation”. This is defined as output falling below 80% of rated capacity within 25 years. If cleaning reveals underlying degradation beyond these thresholds, contact your installer. Don’t confuse permanent degradation with recoverable solar panel soiling loss.
Government and Industry Data on Solar Panel Soiling Loss in Australia
The Australian Photovoltaic Institute (APVI) Solar Map data shows that Australian solar installations consistently underperform their modelled output by 5–20%. Solar panel soiling is cited as the primary recoverable cause in most states.
The CSIRO has conducted soiling research on utility-scale Australian solar farms. They found average solar panel soiling loss rates of:
- 0.04–0.08% per day in clean coastal conditions
- 0.2–0.4% per day during agricultural seasons in inland NSW and QLD
- Up to 1.5% per day during major dust events in arid regions
Scaled to residential systems and 365-day exposure, these figures translate directly to the annual solar panel soiling loss percentages outlined in the state breakdown above.
For homeowners in agricultural or arid regions, these numbers make a compelling case for quarterly cleaning. Each clean is recovering a much larger accumulated solar panel soiling loss than in metropolitan areas.
Sources
Australian Photovoltaic Institute (APVI) — Solar Map performance data and live solar installation statistics across Australian regions. pv-map.apvi.org.au
CSIRO Energy — Research publications on soiling rates and performance loss in Australian solar installations, including utility-scale and residential system studies. csiro.au/en/research/technology-space/energy
Bureau of Meteorology (BOM) — Climate data, rainfall patterns, and dust storm frequency data used to correlate soiling accumulation with environmental conditions. bom.gov.au
Clean Energy Council — Solar installation standards, maintenance guidelines, and performance benchmarking data for Australian solar systems. cleanenergycouncil.org.au
Related: Is Solar Panel Cleaning Worth It · How Often to Clean Solar Panels · Solar Panel Output Drop Diagnosis
Frequently Asked Questions
How much output do dirty solar panels lose?
Soiling losses vary significantly by location and season. In clean coastal areas, dirty solar panels typically lose 2–5% of their output annually. In dusty inland and agricultural regions, solar panel soiling losses of 15–25% between cleans are common. During drought or high pollen seasons, daily losses from soiling can spike to 30–40% on individual panels. This makes understanding solar panel soiling loss critical for Australian solar owners.
What causes solar panel soiling in Australia?
The main causes of solar panel soiling in Australia include: airborne dust and red or orange soil particles (especially inland), pollen from eucalypts and acacias during spring, bird droppings, smoke and soot during bushfire seasons, sea salt film in coastal areas within 5km of the coastline, and biological growth such as lichen, algae, and moss in humid regions. Understanding these soiling types helps you prevent solar panel soiling loss.
Does rain clean solar panels sufficiently?
Rain removes loose surface dust but fails to clean bird droppings, dried mineral deposits, biological growth (lichen, algae), and the thin sticky film that builds up during dry periods. In areas with infrequent rain, solar panel soiling accumulates rapidly between rainfall events. This is why rain alone cannot prevent solar panel soiling loss in most Australian climates.
How do I calculate my soiling losses?
To calculate solar panel soiling losses, compare your current system output from your inverter app against the expected output for your panel specifications and current weather conditions. A drop of more than 5% from your clean-panel baseline indicates soiling loss worth investigating. Soiling calculators using local irradiance data can provide precise estimates of your solar panel soiling loss.
How often should I clean to minimise soiling losses?
The optimal cleaning frequency to minimise solar panel soiling loss depends on your location: coastal and urban areas typically benefit from 1–2 cleans per year; agricultural and inland areas need 2–4 cleans per year; arid and dusty regions may require quarterly or even monthly cleaning to maintain acceptable output levels and reduce solar panel soiling loss.
Frequently Asked Questions
Soiling losses vary significantly by location and season. In clean coastal areas, dirty solar panels typically lose 2–5% of their output annually. In dusty inland and agricultural regions, solar panel soiling losses of 15–25% between cleans are common. During drought or high pollen seasons, daily losses from soiling can spike to 30–40% on individual panels. This makes understanding solar panel soiling loss critical for Australian solar owners.
The main causes of solar panel soiling in Australia include: airborne dust and red or orange soil particles (especially inland), pollen from eucalypts and acacias during spring, bird droppings, smoke and soot during bushfire seasons, sea salt film in coastal areas within 5km of the coastline, and biological growth such as lichen, algae, and moss in humid regions. Understanding these soiling types helps you prevent solar panel soiling loss.
Rain removes loose surface dust but fails to clean bird droppings, dried mineral deposits, biological growth (lichen, algae), and the thin sticky film that builds up during dry periods. In areas with infrequent rain, solar panel soiling accumulates rapidly between rainfall events. This is why rain alone cannot prevent solar panel soiling loss in most Australian climates.
To calculate solar panel soiling losses, compare your current system output from your inverter app against the expected output for your panel specifications and current weather conditions. A drop of more than 5% from your clean-panel baseline indicates soiling loss worth investigating. Soiling calculators using local irradiance data can provide precise estimates of your solar panel soiling loss.
The optimal cleaning frequency to minimise solar panel soiling loss depends on your location: coastal and urban areas typically benefit from 1–2 cleans per year; agricultural and inland areas need 2–4 cleans per year; arid and dusty regions may require quarterly or even monthly cleaning to maintain acceptable output levels and reduce solar panel soiling loss.